Windows Event Logs for SOC Analysts: What an Event ID Actually Proves
Part of Security Operations · Step 3 of 17 · essential
Browse all 27 field guides
- Alert to Conclusion: Investigating Without Tunnel Vision
- From Header to Host: Investigating Phishing in the SOC
- How to Think Like a SOC Analyst in an Interview
- Identity Attacks for SOC Analysts: Sessions, Tokens, MFA and Account Compromise
- The IP Isn't the Attacker: A SOC Analyst's Guide to NAT, VPNs and Proxies
- PowerShell Is Not the Alert: Investigating Living-off-the-Land Activity
- Ransomware Before the Ransomware: What the SOC Should See Before Encryption Starts
- SPF, DKIM and DMARC: What They Actually Prove (and What They Don't)
- Threat Hunting for SOC Analysts: Turning a Suspicion Into a Searchable Hypothesis
- Windows Event Logs for SOC Analysts: What an Event ID Actually Proves (this article)
- One Alert Is Not the Incident: Scoping Security Incidents in the SOC
- Beyond the Alert: CIS Critical Security Controls v8.1 for SOC Analysts
- Six Functions, Not Six Steps: NIST CSF 2.0 for SOC Analysts
- Check the Scope First: ISO 27001 for SOC Analysts
- Search It, Don't Memorise It: NZISM for Security Practitioners
- Same Problem, Four Lenses: CIS vs NIST vs ISO 27001 vs NZISM
- A Claim Is Not Evidence: Security Assurance for SOC Analysts
- Inherent Risk Comes First: Supplier Security Assurance for Analysts
- Present Is Not Effective: How to Test Security Controls
- A Clean Opinion Is Not Zero Risk: How to Read a SOC 2 Report
- Count Is Not Risk: Security Metrics, KPIs and KRIs That Actually Matter
- Read the Scope Before the Findings: How to Review a Penetration Test Report
- Not the Assessment Itself: How to Design a Supplier Security Questionnaire
- Which Part? Cloud and SaaS Security Assurance
- Lead With the Decision: Executive Security Risk Reporting
- Related Is Not Identical: Framework and Control Mapping Without the Spreadsheet Monster
- CIS, NIST, ISO 27001 and NZISM: The Interview Guide for Security Practitioners
An alert lands in the queue. Suspicious PowerShell, an unusual privileged logon, a new scheduled task, a remote authentication from a workstation that doesn't normally see one, a process execution flagged by a rule someone wrote eighteen months ago. The instinct, especially early in a SOC career, is to go and find the Event ID the alert is built on, read it once, and decide from that single record whether the host is compromised.
That instinct is understandable and it's wrong often enough to be worth addressing directly. A 4624 tells you Windows recorded a successful logon. It does not tell you the logon was legitimate, that the account owner was the one sitting at the keyboard, or that the system is fine. A 4625 is not automatically an attack. A 4688 process creation event does not automatically mean malware ran.
An Event ID tells you what Windows recorded. It does not, by itself, tell you whether something malicious happened. Context turns telemetry into evidence.
This article is not another exhaustive Event ID table. There are already plenty of those, and memorising four hundred numbers has never made anyone better at investigations. The point here is to build the reasoning that sits underneath the numbers: what each of the genuinely useful logs and events actually records, what they do and don't prove on their own, and how they combine into something you can actually stand behind. If you've sat with Windows telemetry for a while this should work as a refresher, including for interview prep. If you haven't, it should save you from a few of the more common ways this goes wrong.
analyst@thefish.nz:~$ cat contents.txt
Sections
Where Windows telemetry actually comes from
Before getting into specific events, it's worth having a clear map of where useful Windows telemetry originates, because the source shapes what you can trust and what depends on configuration you may not have.
The Security log is where most of what a SOC cares about lives: authentication, account management, privilege use, and, depending on audit policy, process creation. Almost everything in the first half of this article comes from here. Critically, a lot of what the Security log records depends on the audit policy actually being configured to log it. Windows ships with sensible defaults in modern builds, but command-line logging on process creation, object access auditing for scheduled tasks, and several other useful categories are not automatically switched on. Never assume a category is being logged just because the event exists in principle.
The System log covers services, drivers and general system behaviour. It's less exciting day to day, but it's where you'll find service installation events, which matter more than they sound like they should for persistence investigations.
The Application log holds events generated by installed applications. Its usefulness varies enormously depending on what's actually running on the host. Sometimes it's the thing that tells you a specific piece of software crashed or misbehaved at a meaningful moment; often it's noise specific to whatever's installed.
PowerShell logging is really several separate mechanisms that get talked about as one thing. The PowerShell Operational log captures engine-level lifecycle events. Script Block Logging, which writes to that same Operational log as Event ID 4104, records the actual content of script blocks that were executed, including ones that were deobfuscated at runtime, which is exactly the part that matters most during an investigation. Module Logging records pipeline execution details for specific modules. Transcription is different again: it writes plain-text transcripts of PowerShell sessions to disk rather than to the event log at all. None of this is universally on. It depends entirely on Group Policy or local configuration, and you should find out what's actually enabled in your environment rather than assuming.
Microsoft Defender and Defender for Endpoint, where present, add a genuinely different layer: behavioural detections, process trees with richer context than the Security log alone provides, and cloud-correlated reputation and threat intelligence. This article isn't written assuming Defender is your EDR. The reasoning applies whatever endpoint product you're working with; where I mention it specifically it's as one example of what EDR telemetry generally adds on top of native Windows logging, not a dependency.
Sysmon deserves its own mention because it fills gaps native Windows auditing leaves wide open: process creation with hashes and full command lines regardless of the Security log's own audit policy, network connections, DNS queries, file creation, registry value changes, and more, depending on configuration. The obvious but important caveat: none of this exists unless Sysmon is actually deployed, and the quality of what you get depends heavily on how it's configured. A default Sysmon install with no tuned config file is a lot noisier and less useful than one built against a maintained baseline. If you're investigating a host and Sysmon telemetry simply isn't there, that's usually an environment fact worth noting, not evidence of anything by itself.
Different logs have different strengths and different blind spots, and that's really the whole argument of this article stated as a sentence. Nothing here works well in isolation.
Event IDs worth actually recognising
What follows isn't everything. It's the events that come up often enough, and matter enough when they do, that you should be able to reason about them without stopping to look them up. For each one I want to cover what Windows is actually recording, why it's worth your attention, which fields are worth reading, what it doesn't prove, and what else you'd want to pull alongside it.
4624: An account was successfully logged on
Windows records this whenever a logon session is created, whatever the source. The fields worth reading are the account name and domain, the Logon ID (useful for tying this session to everything else that happens under it), the logon type, the authentication package, and, where populated, the workstation name and source network address.
Logon type is the single most important field on this event and it's the one people skip past most often. A 2 means Interactive: someone typed credentials at the local console. A 3 means Network: this covers a huge amount of ordinary activity, from a user browsing a file share to a service account authenticating to another server, and on its own tells you almost nothing about intent. A 10 means RemoteInteractive, which is RDP (or Remote Assistance) rather than physical console access, and is worth noticing specifically because it changes what "logged on" actually means for that session.
A few others are worth knowing exist even if they come up less often in day-to-day triage. Type 4, Batch, is what you'll see when a scheduled task runs under an account rather than a person triggering it interactively, so a batch logon at 3am for a service account is often completely normal and a batch logon for a user account that's never run a scheduled task is worth a second look. Type 5, Service, is a service starting under an account. Type 8, NetworkCleartext, means credentials were passed across the network in a form Windows could see in the clear, most commonly IIS Basic Authentication, and is worth flagging when you see it somewhere you didn't expect Basic Auth to be configured. Type 11, CachedInteractive, means the logon used cached domain credentials because a domain controller wasn't reachable at the time, which matters if you're trying to establish whether a device was actually on the corporate network when something happened.
Watch out
None of this tells you the logon was legitimate. It doesn't tell you the account owner physically typed the password, and it doesn't tell you the host is compromised just because the logon type looks unusual for that user. What it gives you is a precise, timestamped fact: this account, this logon type, from this source, at this time. Everything past that is interpretation, and the interpretation gets stronger once you correlate it with what happened in that logon session afterwards, and whether this pattern is normal for this account and this system.
4625: An account failed to log on
The temptation with 4625 is to read a cluster of failures as an attack in progress. Sometimes that's right. Often the actual explanation is a stale scheduled task still using an old password, a service account whose credentials were rotated somewhere but not everywhere, a user who fat-fingered their password twice before getting it right, a legitimate scanner or monitoring tool with outdated credentials, or a genuinely malicious spray or brute-force attempt.
What actually distinguishes these is volume and distribution, and it's worth being deliberate about which shape you're looking at. A hundred failures against a single account from a single workstation over a few minutes reads like a brute-force attempt against that account, or possibly a broken application retrying with a stale credential in a tight loop, both of which are worth investigating but for different reasons and with different urgency. One failure each against a hundred different accounts from the same source, spread across a short window, reads like a password spray, and the useful follow-up question is whether any of those hundred attempts subsequently succeeded. The failure reason and sub-status code, wrong password versus unknown username versus a locked or disabled account, are genuinely useful here too: a wave of "account does not exist" failures against a naming pattern looks different from a wave of "wrong password" failures against known accounts, and points you toward a different explanation.
The event itself just tells you an authentication attempt didn't succeed and roughly why. Whether that adds up to reconnaissance, a spray, a misconfigured service, or someone who's forgotten their own password depends on everything around it.
4672: Special privileges assigned to new logon
This one gets over-read constantly. 4672 fires when a logon is granted an administrative or otherwise privileged token, which happens for an enormous amount of entirely routine activity: domain admins logging onto anything, plenty of service accounts, and various pieces of legitimate tooling that need elevated rights to function.
Watch out
Seen alone, 4672 tells you almost nothing, and treating it as evidence of privilege escalation on its own is one of the more common mistakes I see. Where it becomes genuinely interesting is in combination: a privileged token being assigned on a logon type or from a source that doesn't fit that account's normal pattern, or immediately alongside other activity that looks like lateral movement or credential misuse. The event is a signal worth having on hand for correlation, not a conclusion by itself.
4688: A new process has been created
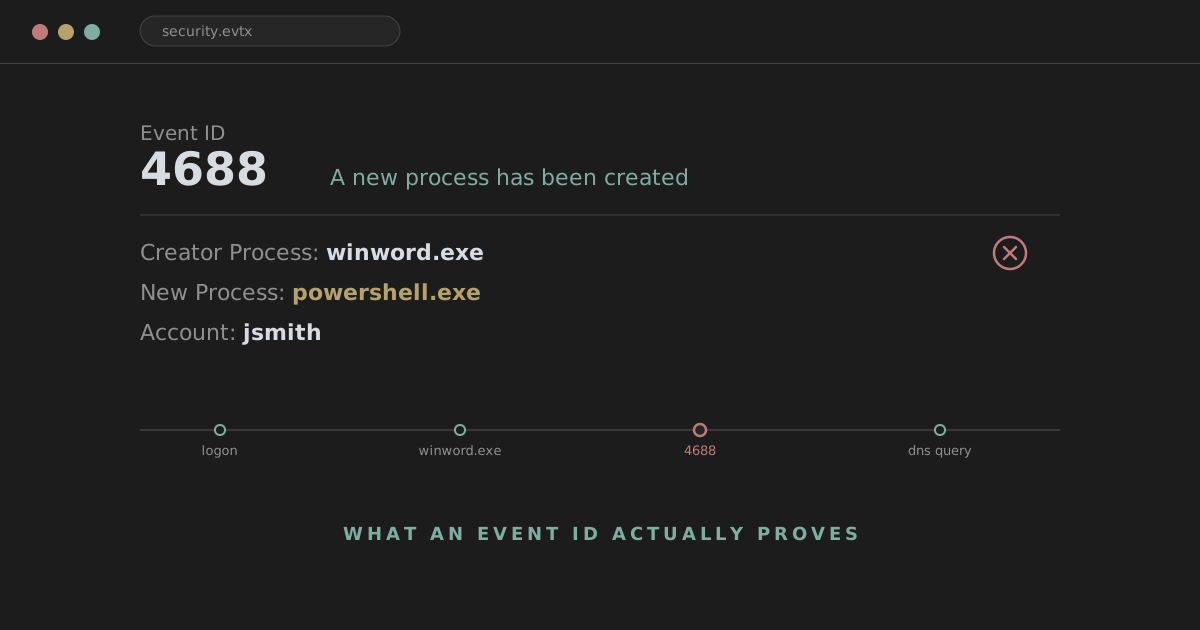
This is one of the most consistently useful events in the whole Security log, and its value is almost entirely in the relationships it exposes rather than the event in isolation. The fields worth reading are the new process name and ID, the creator (parent) process name and ID, the account context, the timestamp and, if command-line auditing is enabled, the full command line. That last part matters enough to say plainly: command-line logging on 4688 is not on by default. It requires both the "Audit Process Creation" subcategory and the separate "Include command line in process creation events" policy to be enabled. If your environment hasn't done that, 4688 still tells you a process started and what its parent was, but not what arguments it was given, which is a real gap. Sysmon's process-create event captures the command line regardless of that Windows audit setting, which is one of the reasons it's worth having alongside native auditing rather than instead of it.
The parent-child relationship is usually the most immediately informative part of the event. winword.exe launching powershell.exe is a pattern worth looking at hard, because Word doesn't normally need to spawn a shell. outlook.exe launching cmd.exe sits in the same category. services.exe launching a binary nobody recognises is worth chasing down, particularly if that binary lives somewhere unusual. But an unfamiliar or unusual-looking chain is a reason to investigate, not a verdict on its own; plenty of legitimate software does things that look odd out of context, and the way to tell the difference is to keep pulling on the thread rather than stopping at the first surprising parent process.
Account creation and modification
A handful of events cover the lifecycle of a user account: 4720 records a user account being created, 4722 an account being enabled, 4724 an attempt to reset an account's password, and 4726 an account being deleted. Individually these are mostly administrative housekeeping. They become interesting when they show up somewhere they shouldn't: an account created outside the normal provisioning process or window, an account created and enabled shortly before being used for something else, or a password reset that doesn't correspond to a helpdesk ticket or a user-initiated request. These events are frequently part of the story in persistence and privilege-escalation investigations precisely because creating or resurrecting an account is a simple, durable way to keep access.
Group membership changes
The events worth knowing here are 4728, a member added to a security-enabled global group, 4732, a member added to a security-enabled local group, and 4756, a member added to a security-enabled universal group. Rather than memorising which number goes with which scope, it's more useful to understand the underlying distinction: a local group's membership only matters on that specific machine, local Administrators being the obvious example, a global group's scope sits within a single domain, and a universal group can span an entire forest. The event that should get your attention fastest, almost every time, is a change to a local Administrators group on an endpoint, or a change to any genuinely privileged domain group like Domain Admins. Someone being added to a privileged group they don't normally belong to, particularly outside a documented change window, is exactly the kind of thing worth chasing regardless of which specific event number recorded it.
Scheduled tasks
Scheduled tasks are used constantly for entirely legitimate reasons: software updates, backup jobs, maintenance scripts, monitoring agents. They're also a genuinely common persistence mechanism, because a task that re-executes a payload on logon or on a schedule is simple, reliable and easy to overlook.
Two log sources cover this. The Security log's 4698 records a scheduled task being created, but only if the relevant object-access auditing subcategory is enabled, which isn't universal. The Task Scheduler's own operational log records registration, update, deletion and execution of tasks more directly, with event IDs in the 100 to 200 range depending on the specific action, and is often available even where the Security log side isn't configured for it. Whichever source you're working from, the fields that actually matter are consistent: the task name, who created it, the exact command or action it runs, the execution path of anything it invokes, the creation timestamp and the account context it runs under. A task created moments before it first executes, running from a temp or user-writable directory, under an account that doesn't normally create tasks, is a very different picture from a task that's been sitting there for two years running a signed vendor binary from Program Files on a predictable schedule.
Services
Service creation is the System log's equivalent of the scheduled-task story. Event ID 7045, "A service was installed in the system", is logged by the Service Control Manager and, usefully, doesn't depend on a special audit policy the way some of the Security log events do. The Security log has its own version, 4697, which does require object-access auditing to be enabled.
Legitimate software deployment creates services constantly, so the event alone is unremarkable. What's worth checking is the binary path, is it somewhere expected, or a temp directory or an unusual location, the service account it's configured to run as, the service name, does it look like it's deliberately mimicking a legitimate Windows service name, the creation time relative to anything else going on, the host it appeared on, and whether the binary itself is signed and by whom. A new service with an unsigned binary in an odd path, created around the same time as other suspicious activity on that host, deserves attention. A new service that matches a documented software rollout across a fleet of machines usually doesn't.
Event log clearing
Event ID 1102 records the Security log being cleared, and System log clearing has its own equivalent, Event ID 104. The genuinely useful thing to understand here is that clearing the log is itself an action that gets logged: 1102 is typically the very next entry written after the clear, timestamped at the moment it happened, which is exactly the kind of anomaly worth investigating on its own. An attacker trying to cover their tracks by clearing the Security log leaves behind a clear marker that they did so.
Watch out
The other side of this is just as important. Missing logs are not automatically evidence of tampering. Retention limits, log rotation, a forwarding agent that was down, a collector outage, or simply an audit policy that was never configured to capture what you're looking for can all explain a gap just as easily as deliberate interference. Before concluding someone cleared evidence, check whether there's a more mundane explanation available, and treat 1102 itself, when it does appear, as a strong and specific signal rather than reading every gap in your logs the same way.
PowerShell: why it shows up so often, and why that's not the whole story
PowerShell turns up constantly in incident investigations, and it's worth being precise about why, because the honest answer isn't "PowerShell is malicious." It's that PowerShell is a powerful, fully-featured scripting environment that ships on every modern Windows install, can do almost anything an attacker wants, download and execute content, interact with the network, touch credentials, manipulate the registry, and, depending on configuration, can be run in ways that leave surprisingly little trace. That combination makes it attractive to attackers for the same reasons it's useful to administrators. The tool isn't the tell. The context around how it was invoked is.
The first thing worth checking is the same parent-child relationship that matters for 4688 generally: PowerShell spawned by Office applications, by a browser, or by a document handler is worth far more attention than PowerShell spawned by a management tool, a logon script, or an administrator's own interactive session. The command line itself matters enormously where you have it, whether from 4688 with command-line auditing enabled or from Sysmon. An encoded command (the -enc or -EncodedCommand flag, base64-encoded arguments), heavy obfuscation, string concatenation designed to evade simple pattern matching, or a command that reaches out to download and execute remote content, broadly anything that fetches a script or payload from a remote location and runs it in the same breath, are all patterns worth immediate attention.
This is where Script Block Logging and Event ID 4104 earn their keep. PowerShell can deobfuscate a command at runtime before executing it, which means the plain command line you'd see elsewhere can look meaningless while the actual behaviour is anything but. Script Block Logging captures the block of code PowerShell is actually about to run, often after that deobfuscation has happened, which is precisely the point where an attacker's evasion technique stops helping them. Where it's enabled, it's frequently the single most useful PowerShell artefact you have. Where it isn't, that's a real gap worth noting rather than assuming the command line alone tells the whole story.
Analyst tip
PowerShell's execution policy is not a security boundary; it's a default-safety mechanism aimed at preventing accidental script execution, and it's trivially bypassed by design, -ExecutionPolicy Bypass exists precisely because Microsoft never intended it to stop a deliberate attacker. Its absence or bypass is not itself evidence of anything beyond "someone didn't want the default prompt behaviour." PowerShell is also one example among many of a living-off-the-land binary, a legitimate, signed, expected piece of the operating system that also happens to be useful for malicious purposes. The same reasoning applies to certutil, mshta, rundll32, regsvr32 and a long list of others: presence is not proof, and the question is always whether this specific invocation, in this specific context, fits how that tool is normally used in your environment.
None of this means every PowerShell alert deserves the same weight. Administrative scripts, deployment tooling and monitoring agents run PowerShell constantly, usually from expected parent processes, on a predictable schedule, without obfuscation. Telling that apart from something worth escalating comes down to the same questions as everything else in this article: what launched it, what did it actually do, does that match what's normal here, and what happened immediately afterwards.
What Sysmon adds
Sysmon exists to fill the gaps native Windows logging leaves open, and it's worth understanding conceptually what it adds rather than trying to memorise its full event schema. A handful of its events come up constantly enough to know by number: Event 1, Process Create, gives you process creation with the full command line and file hashes regardless of the Security log's own audit policy; Event 3, Network Connection, records outbound and inbound TCP connections with source and destination detail; Event 11, File Create, records files being written to disk; Event 13, Registry Value Set, records registry modifications, which matters a great deal for persistence mechanisms that live in Run keys and similar locations; and Event 22, DNS Query, records DNS resolution requests made by a process, which is often the first externally-visible sign of something reaching out.
None of this exists unless Sysmon is deployed and configured to capture it, and a poorly tuned Sysmon config can bury you in noise just as easily as it can surface something useful. Where it's properly deployed, its real value isn't any single event type on its own, it's that these events give you a much finer-grained picture of what a process actually did between the moment it started and the moment it finished, which is exactly the texture that turns "PowerShell ran" into an actual behavioural story.
User opens document
↓
winword.exe
↓
powershell.exe
↓
DNS query
↓
HTTPS connection
↓
file written
↓
new process launched
No single link in that chain proves anything by itself. A document opening is normal. A process launching is normal. A DNS query and an outbound connection are normal, constantly, across an entire estate. It's the chain, in this order, in this short a window, that turns a set of individually unremarkable events into something worth writing up.
A worked investigation
Here's a realistic shape for how this comes together, the kind of thing you'd actually be reconstructing from a ticket. A user opens a document, and shortly afterwards an alert fires for suspicious PowerShell activity on that host. The raw timeline, pulled from several sources, looks something like this.
| Time | Event |
|---|---|
| 09:14:03 | User logs on |
| 09:17:41 | winword.exe starts |
| 09:17:53 | winword.exe launches powershell.exe |
| 09:17:54 | PowerShell executes a suspicious command |
| 09:17:55 | Host resolves an unusual domain |
| 09:17:56 | Host establishes an outbound connection |
| 09:18:02 | A payload is written to disk |
| 09:18:05 | The payload executes |
| 09:19:12 | A scheduled task is created |
Walking through it stage by stage, and being deliberate about what's actually known versus inferred at each point, matters more than the timeline itself.
The 09:14:03 logon is a Security log fact: this account, this logon type, this source. It establishes who and where, nothing more yet. winword.exe starting at 09:17:41 is a 4688 or Sysmon Event 1, unremarkable on its own; people open documents constantly. The 09:17:53 parent-child link, Word launching PowerShell, is where the story actually starts, because that's not something Word does as part of normal document rendering, and evidence supports treating it as the pivot point worth building the rest of the timeline around.
The command PowerShell executes a second later is where Script Block Logging, 4104, earns its place, if it's enabled; without it, you may only have whatever the raw command line gives you, which could be an obfuscated string that tells you less than you'd want. The DNS resolution and outbound connection that follow are Sysmon Events 22 and 3, or equivalent network telemetry, and they establish that the host reached out somewhere, though on their own they don't yet tell you what was received or what it did once it arrived. The file write at 09:18:02, Sysmon Event 11, and the subsequent process execution at 09:18:05 are where you'd want file hash, path and signing status, and ideally a reputation check against that hash. The scheduled task creation at 09:19:12, 4698 or the Task Scheduler operational log, is the point where this stops looking like a one-off execution and starts looking like an attempt at persistence.
Put together, the evidence supports a reasonably confident conclusion: a document opened by this user led to PowerShell execution, which reached out to an external domain, retrieved and executed a payload, and established persistence via a scheduled task. What remains genuinely unknown without further work is the specific nature of the payload, whether credentials were touched, whether the activity spread to any other host, and what the task is actually configured to do on its next trigger. That's the honest boundary of what this particular timeline proves, and it's worth stating explicitly rather than rounding it up to more than the evidence actually supports.
Why correlation is the whole point
Every individual source of Windows telemetry has blind spots. The Security log doesn't see network traffic. PowerShell logging doesn't see what happened before or after the PowerShell session itself. Sysmon doesn't see DNS responses, only the query. None of them, alone, gives you the full behavioural picture, and treating any one of them as sufficient is how you end up with either false confidence or a stalled investigation.
Windows Security
+
PowerShell logs
+
Sysmon / EDR
+
DNS
+
Firewall / proxy
=
a much stronger investigation
The value isn't just additive. Independent sources agreeing on the same explanation is a fundamentally different kind of evidence than five fields pulled from a single log entry restated five ways. A Security log logon, a Sysmon process chain, a DNS query and a proxy log entry that all point the same direction, from systems that don't depend on each other, is worth far more than any one of them individually, however detailed that one entry is.
Missing telemetry
At some point in most investigations, something you'd expect to find simply isn't there. Command-line auditing wasn't enabled. Script Block Logging wasn't configured. The Security log rolled over before you got to it. The endpoint was offline during the window you care about. The log forwarder or collector had an outage. Sysmon was never installed on that host. The EDR sensor was unhealthy or hadn't checked in. Clocks were skewed enough to make correlation harder than it should be. And yes, sometimes, an attacker genuinely did tamper with logging.
Watch out
Missing evidence should change your confidence, not automatically become evidence of something specific. A gap makes a conclusion weaker or forces you to lean more heavily on whatever sources you do have; it doesn't, by itself, prove evasion. Jumping straight to "the attacker must have cleared this" when the simpler explanation is a misconfigured audit policy or a genuinely offline collector is its own kind of mistake, just in the opposite direction from taking every event at face value.
A short word on time
Timestamps cause more quiet confusion in investigations than almost anything else on this list, and it's worth being deliberate about them. Windows event logs record time in UTC internally, but what you see displayed depends on the tool and the local system timezone, and a SIEM that's normalised timestamps from multiple sources may present something different again from what's in the raw event. Always confirm which timezone you're actually looking at before you start lining events up against each other, particularly when correlating a Windows host's local logs against a SIEM's normalised view or against a completely different system's logs.
A few other things worth keeping in mind: ingestion time, when your SIEM received an event, is not the same as event time, when it actually happened, and the gap between them can be seconds or considerably longer depending on forwarding and processing delays. Clock drift on endpoints that aren't syncing reliably against a time source can throw correlation off by minutes, which is enough to make a genuinely related sequence of events look disconnected. And daylight-saving transitions are a recurring, entirely mundane source of an hour's worth of apparent confusion twice a year, worth ruling out early rather than chasing a phantom explanation for a discrepancy that's actually just DST.
Questions worth asking yourself
A short list I find genuinely useful to run through, particularly the last two.
That last pair matters more than the rest of the list combined. It's easy to gather evidence that supports a theory you've already half-decided on. Deliberately going looking for what would prove you wrong is the habit that actually catches mistakes before they end up in a write-up.
Detection versus investigation
These use the same telemetry but ask different questions, and it's worth keeping them separate in your head. Detection asks: what telemetry could indicate this behaviour, broadly, across an entire estate, in a way generic enough to fire reliably without drowning in false positives? Investigation asks: what actually happened, on this specific host, in this specific window, given everything available?
The same 4688 event can be both things at once without contradiction. It might be the exact trigger that fired a detection rule, and separately, once you're in the investigation, it's one piece of evidence among several rather than the conclusion. Confusing the two roles, treating a detection rule's trigger condition as though it were itself proof of the underlying behaviour, is a quiet but common source of overconfident write-ups.
Common mistakes worth naming directly
Memorising Event IDs without understanding what they actually record and what they don't. Treating a batch of failed logons as automatic evidence of a brute-force attempt without looking at volume and distribution. Treating any PowerShell execution as inherently malicious. Reading 4672 as privilege escalation on its own. Skipping past logon type as though it doesn't change what a logon actually means. Ignoring parent processes and working from the process name alone. Focusing entirely on one endpoint when the same activity might be happening elsewhere. Losing track of timezone and ingestion-versus-event-time when building a timeline. Assuming the absence of logs means nothing happened, rather than that nothing was recorded. And assuming your SIEM's ingested data represents every event the endpoint actually generated, when forwarding gaps, filtering and collector issues are all genuinely common.
None of these are exotic mistakes. They're the ordinary, easy-to-fall-into ones, and most of this article is really just an argument against making them.
Things worth being able to explain in a SOC interview
Not a list of interview questions, just the concepts a senior analyst should be comfortable talking through without notes: the practical difference between 4624 and 4625 and what each one does and doesn't establish; what logon types actually mean and why the distinction matters for interpreting a logon; why 4688 is valuable and specifically why the parent-child relationship is usually more informative than the process name alone; what Script Block Logging and Event 4104 add that a plain command line sometimes can't; what Sysmon adds on top of native Windows auditing and why its usefulness depends on deployment and configuration; why a single Event ID is rarely sufficient evidence on its own; how to build and reason about a timeline from multiple independent sources; and how to handle missing telemetry without either ignoring the gap or treating it as automatic proof of tampering. If you can talk through each of those clearly, with an example, you're in good shape.
Quick reference
A genuinely useful set to keep on hand, not a complete encyclopedia.
| Event | Source | What it tells me | Useful correlation |
|---|---|---|---|
| 4624 | Security | A logon succeeded; account, logon type, source | Sysmon process creation, subsequent activity in that logon session |
| 4625 | Security | A logon failed, and why | Volume and distribution across accounts/sources, subsequent successful logon |
| 4672 | Security | A privileged token was assigned at logon | The logon event itself, whether this account/host/type combination is expected |
| 4688 | Security | A process was created; parent, child, account | Sysmon Event 1, command-line content, network activity from the same process |
| 4104 | PowerShell Operational | The actual script block content, post-deobfuscation | 4688/Sysmon 1 for the PowerShell process, subsequent network activity |
| 4103 | PowerShell Operational | Module/pipeline execution details | 4104 for the same session |
| 4698 | Security | A scheduled task was created | Task Scheduler Operational log, the process that created it |
| 106/200/201 | TaskScheduler Operational | Task registration and execution | 4698 (if enabled), the account context, the command the task runs |
| 7045 | System | A service was installed | Binary path, signing status, service account |
| 4697 | Security | A service was installed (audit-policy dependent) | Same as 7045 |
| 4720 | Security | A user account was created | Who created it, when, against normal provisioning |
| 4722 | Security | A user account was enabled | Recent creation events, subsequent logon activity |
| 4724 | Security | A password reset was attempted | Whether it matches a legitimate request |
| 4728 / 4732 / 4756 | Security | A member was added to a security group (global/local/universal) | Which group, particularly privileged ones; who made the change |
| 1102 | Security | The Security log was cleared | Everything immediately before and after; who was authenticated at the time |
| Sysmon 1 | Sysmon | Process creation with hashes and full command line | 4688, network events from the same PID |
| Sysmon 3 | Sysmon | A network connection was made | DNS query (Sysmon 22), proxy/firewall logs |
| Sysmon 11 | Sysmon | A file was created | Hash and reputation of the file, the process that wrote it |
| Sysmon 13 | Sysmon | A registry value was set | Whether the key is a known persistence location |
| Sysmon 22 | Sysmon | A DNS query was made | The connection that follows, domain reputation/age |
The takeaway
None of this is really about the numbers. Events are observations, individually thin and easy to misread in isolation. A timeline puts them in order. Correlation across independent sources gives that order context. What you're left with, if you've done it properly, is something you can actually stand behind rather than something that merely felt right at the time. That's the whole discipline, and it applies whether you're triaging your fortieth alert of the shift or explaining how you'd approach the forty-first in an interview.
References
- Microsoft Learn, Security Event ID reference (e.g. Event 4624, and equivalents for 4625, 4688, 4672, 4720 by swapping the event number)
- Microsoft Learn, Appendix L: Events to Monitor
- Microsoft Sysinternals, Sysmon documentation
- Microsoft Learn, about_Logging_Windows, covering PowerShell Script Block and Module Logging, Event 4104
- MITRE ATT&CK
- SigmaHQ