Threat Hunting for SOC Analysts: Turning a Suspicion Into a Searchable Hypothesis
Part of Security Operations · Step 10 of 17 · essential
Browse all 27 field guides
- Alert to Conclusion: Investigating Without Tunnel Vision
- From Header to Host: Investigating Phishing in the SOC
- How to Think Like a SOC Analyst in an Interview
- Identity Attacks for SOC Analysts: Sessions, Tokens, MFA and Account Compromise
- The IP Isn't the Attacker: A SOC Analyst's Guide to NAT, VPNs and Proxies
- PowerShell Is Not the Alert: Investigating Living-off-the-Land Activity
- Ransomware Before the Ransomware: What the SOC Should See Before Encryption Starts
- SPF, DKIM and DMARC: What They Actually Prove (and What They Don't)
- Threat Hunting for SOC Analysts: Turning a Suspicion Into a Searchable Hypothesis (this article)
- Windows Event Logs for SOC Analysts: What an Event ID Actually Proves
- One Alert Is Not the Incident: Scoping Security Incidents in the SOC
- Beyond the Alert: CIS Critical Security Controls v8.1 for SOC Analysts
- Six Functions, Not Six Steps: NIST CSF 2.0 for SOC Analysts
- Check the Scope First: ISO 27001 for SOC Analysts
- Search It, Don't Memorise It: NZISM for Security Practitioners
- Same Problem, Four Lenses: CIS vs NIST vs ISO 27001 vs NZISM
- A Claim Is Not Evidence: Security Assurance for SOC Analysts
- Inherent Risk Comes First: Supplier Security Assurance for Analysts
- Present Is Not Effective: How to Test Security Controls
- A Clean Opinion Is Not Zero Risk: How to Read a SOC 2 Report
- Count Is Not Risk: Security Metrics, KPIs and KRIs That Actually Matter
- Read the Scope Before the Findings: How to Review a Penetration Test Report
- Not the Assessment Itself: How to Design a Supplier Security Questionnaire
- Which Part? Cloud and SaaS Security Assurance
- Lead With the Decision: Executive Security Risk Reporting
- Related Is Not Identical: Framework and Control Mapping Without the Spreadsheet Monster
- CIS, NIST, ISO 27001 and NZISM: The Interview Guide for Security Practitioners
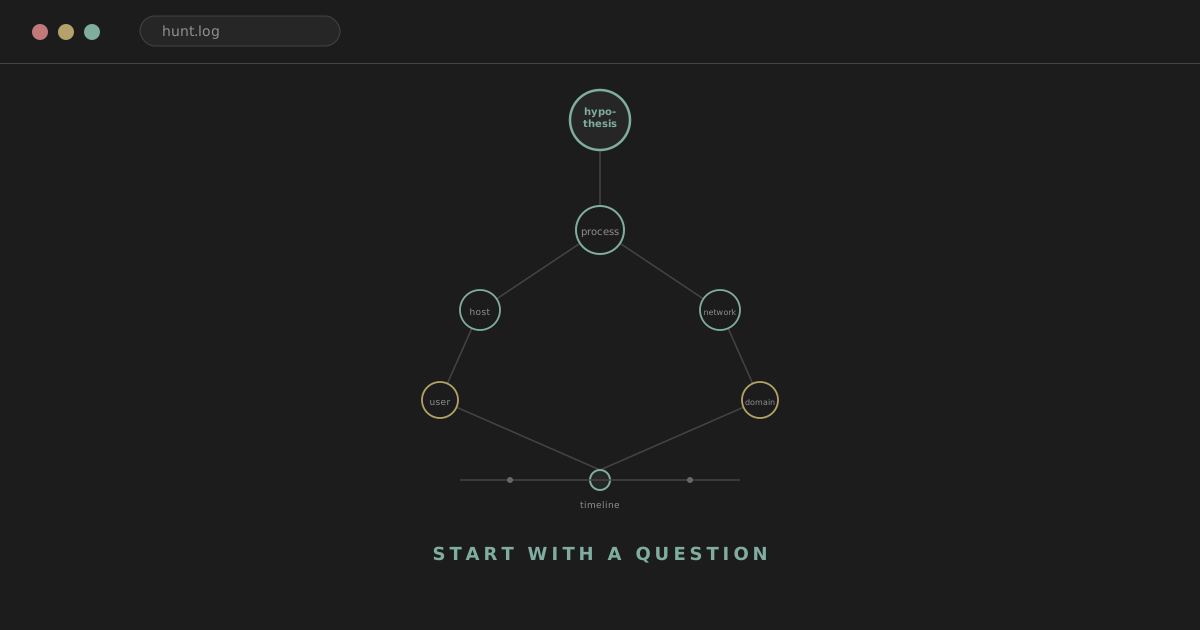
Threat hunting is not searching logs until something looks strange. That approach produces long, tired sessions of scrolling through data with no real endpoint, and it's a genuinely common way people burn time without learning much. A useful hunt starts with a question.
Suspicion
↓
Hypothesis
↓
Required telemetry
↓
Search
↓
Pivot
↓
Validate
↓
Scope
↓
Conclusion
↓
Detection improvement
Hunting is iterative, not linear in practice, whatever that diagram suggests. A hunt can confirm the hypothesis, reject it outright, reveal a completely different behaviour than the one you set out looking for, expose a telemetry gap you didn't know existed, or surface a genuine detection opportunity.
Analyst tip
A hunt that finds no attacker isn't a failed hunt if it properly tested something worth testing. Coming back with "we looked for this specific behaviour, across this time window, using this telemetry, and found nothing" is a real, useful result, not an empty one.
analyst@thefish.nz:~$ cat contents.txt
Sections
- Alert investigation vs hunting
- What makes a good hypothesis
- Where hunting ideas come from
- How hunts mature
- A reusable hunt workflow
- Baselines worth building
- Rare process hunting
- Parent-child process hunting
- PowerShell hunts
- Authentication hunts
- Lateral movement hunts
- Network, DNS and more
- Email and identity hunts
- Ransomware precursor hunting
- A mental model for queries
Alert investigation versus threat hunting
Reactive investigation starts with an alert and asks what happened here. Threat hunting starts with a hypothesis and asks whether this behaviour could already exist somewhere else, entirely independent of whether anything has fired yet.
Reactive investigation

Alert
   ↓
What happened here?
Threat hunting

Hypothesis
   ↓
Could this behaviour already exist elsewhere?
Say an incident investigation turns up winword.exe → powershell.exe. A weak follow-up would be searching the specific malicious domain across the estate, useful, but narrow, and it stops working the moment the attacker changes infrastructure. A stronger hunt generalises the behaviour: where else has an Office process launched a scripting interpreter, particularly where network activity followed shortly after? That question survives a changed domain, a changed hash, and a changed payload, because it's built on the shape of the behaviour rather than the specific artefacts of one instance of it.
What makes a good hypothesis
Poor: "find hackers." Poor: "look for weird PowerShell." Better: "an attacker using a malicious document may cause an Office application to spawn PowerShell or another scripting interpreter, followed by network activity." Better still: "Office applications rarely launch scripting interpreters on standard user workstations in this environment. Instances where they do, particularly where outbound network activity follows, may indicate malicious document execution."
A good hypothesis is testable, tied to observable behaviour rather than a vague feeling, narrow enough that you can actually build a search around it, and broad enough that it doesn't depend entirely on one specific indicator surviving unchanged.
Where hunting ideas actually come from
Incident findings. Often the best source available. Take one behaviour discovered during a real investigation and ask where else it might have happened.
Threat intelligence. Reports describe behaviour, tooling, technique and infrastructure. Extract the behaviour rather than blindly importing a list of IOCs that will be stale within weeks.
MITRE ATT&CK. Genuinely useful for thinking about attacker behaviour and the telemetry it would leave behind. It doesn't tell you whether you actually collect that evidence in your own environment, which is a separate question worth answering honestly before building a hunt around a technique you can't actually see.
Detection gaps. An alert that nearly missed something, that fired late, or that fired on a near-miss, is a natural hunt hypothesis waiting to be written down.
Environment knowledge. Something like "we have very few legitimate interactive service-account logons" directly implies that service-account interactive authentication is worth hunting, because the baseline for that behaviour is already known to be thin.
Vulnerability and exposure knowledge. A recently exploited remote-access product sitting in your environment is a reason to hunt for the behaviour associated with compromise generally, not only for signatures of the specific exploit.
Peer and security research. Useful as inspiration, translated into the telemetry you actually have, rather than copied wholesale as someone else's query built for someone else's environment.
How hunts mature
Not a formal industry standard, just a useful learning model for thinking about how a hunt can deepen.
Level 1   IOC search
Level 2   Behaviour search
Level 3   Behaviour + context
Level 4   Cross-source correlation
Level 5   Temporal sequence
Level 6   Baseline / prevalence
Level 7   Environment-wide behavioural analytics
Level 1: IOC hunt
Search for bad-domain[.]example across DNS, proxy, firewall, EDR and email telemetry. Known indicators are high-value pivots, and this is a completely legitimate place to start.
Watch out
The limitation is real too: attackers change domains, infrastructure rotates, shared hosting muddies attribution, historical telemetry may not exist, and the indicator may never actually have been observed in your environment at all. IOC hunting is useful, but fragile.
Level 2: Behaviour hunt
Generalise the activity. Instead of "who contacted this domain," ask which Office processes spawned scripting interpreters, conceptually:
parent in (winword.exe, excel.exe, powerpnt.exe, outlook.exe)
child  in (powershell.exe, pwsh.exe, cmd.exe, wscript.exe, cscript.exe, mshta.exe)
Even this produces plenty of legitimate results on its own. The next stage is adding context.
Level 3: Behaviour plus context
Add user, host type, signer, command line, prevalence, working hours, asset role, and process path. Office spawning PowerShell on a developer workstation is a meaningfully different situation from the identical pattern on a kiosk or a finance laptop, and the raw behaviour alone can't tell those apart.
Level 4: Cross-source correlation
Combine weaker signals from different sources into a stronger lead:
Office spawns PowerShell
        +
DNS to first-seen domain
        +
external TLS
        +
new file
Each element individually might not justify much attention. Combined, from EDR, Windows logs, DNS, proxy, firewall, identity, email and cloud telemetry, the picture strengthens considerably.
Level 5: Temporal hunting
Sequence, not just co-occurrence, within a tight window:
Office
↓
PowerShell
↓
DNS
↓
file creation
↓
scheduled task
A sequence happening within fifteen minutes is a very different claim from the same five events scattered loosely across a day. Worth being realistic about the practical challenges here: timestamp accuracy, clock skew between systems, ingestion delay before events land in your SIEM, and telemetry that's simply missing for part of the chain.
Level 6: Prevalence and baselining
How common is this, really? A command line seen once is a different situation from the same command line seen daily on four thousand machines. A destination first seen today is different from one contacted by every workstation for the past two years.
Watch out
Rare is not malicious. Common is not safe. Prevalence adjusts confidence; it doesn't set the verdict on its own.
Level 7: Deviation from expected relationships
The most mature hunting asks about relationships rather than events: a service account authenticating interactively, a privileged account originating from an ordinary user workstation, a single workstation connecting directly to an unusually large number of servers, a user communicating with infrastructure that's never been seen before anywhere in the estate, an endpoint running software nothing else in the environment runs. This moves well past static indicator logic into genuine behavioural analytics.
A reusable hunt workflow
1. State the hypothesis. What behaviour do I actually think might exist? 2. Identify observable evidence. What telemetry would that behaviour leave behind? 3. Confirm visibility. Do we actually collect it? 4. Build a broad first search. Don't over-filter immediately. 5. Examine prevalence. What does normal actually look like here? 6. Add context. Users, hosts, processes, assets. 7. Pivot. Follow whatever entities turn out to be interesting. 8. Validate. Determine what actually happened, not just what looks unusual. 9. Scope. Where else does this exist? 10. Document. What did we actually learn? 11. Operationalise. Should this become a detection, a dashboard, a scheduled search, a logging improvement, or a control improvement, or none of those?
Start broad, then reduce
Writing an ultra-specific search first can hide the useful results inside the noise you filtered away before ever looking at it. Start with Office spawning PowerShell broadly. Suppose it returns five thousand events. Now analyse which hosts, which parents, which users, which command lines, which are repetitive versus rare. Reduce known-legitimate patterns from there, deliberately, rather than assuming from the start what's normal. Worth resisting the urge to immediately build a giant permanent allowlist from the first pass; today's noise reduction shouldn't quietly become a permanent blind spot.
Baselines worth building
Host baseline. What normally runs here. User baseline. Where this identity normally authenticates from. Process baseline. What parent normally launches this process. Network baseline. Which destinations are common for this host or user. Service-account baseline. Which hosts this service identity normally touches. Time baseline. When this behaviour normally occurs. Worth remembering that baselines drift as environments change, so revisiting them periodically matters more than treating any one baseline as permanent.
Rare process hunting
Start with processes appearing on very few endpoints. Worth asking: is it signed, is the vendor expected, what path is it running from, what's the parent, what's the hash, when was it first seen, does it touch the network, which user ran it, and what child processes does it spawn.
Rare binary
   ↓
Rare + unsigned
   ↓
Rare + user-writable path
   ↓
Rare + unusual parent
   ↓
Rare + outbound network
This can genuinely reveal malware. It can just as easily reveal a niche legitimate tool one team happens to use that nobody else in the estate touches, which is exactly why rarity alone is a starting point rather than a finding.
Parent-child process hunting, a core technique
Office spawning a scripting interpreter, a browser spawning mshta.exe, a PDF reader spawning cmd.exe, a service process spawning an unexpected executable, an unusual shell spawned by a server application. The relationship between parent and child is very often more valuable than either process considered on its own, because the parent tells you the story of how this execution actually came about.
PowerShell hunts, a progression
Beginner: find PowerShell. Better: find rare PowerShell command lines rather than every invocation. Better again: find suspicious parent processes specifically. Better again: find PowerShell paired with first-seen network destinations. Better still: find PowerShell paired with file creation and something resembling persistence. Each stage narrows toward genuinely interesting activity without depending on any single indicator. This connects directly to the reasoning in the PowerShell and LOLBins guide.
LOLBin hunting
mshta, rundll32, regsvr32, certutil, wmic, bitsadmin, schtasks, sc: hunt based on unusual parent processes, unusual arguments, remote content, execution from user-writable paths, associated network activity, and persistence appearing shortly afterward. The binary name is never the finding on its own.
Authentication hunts
Password spray. Start with a broad view of failed authentications. Evolve toward one source, many accounts, relatively few attempts against each, all within a short window. Then check whether any of those accounts subsequently succeeded, and if so, investigate what that identity actually did next.
Privileged account on an unusual workstation. Start with privileged authentication events generally. Add the source host, that account's historical sources, the target system, the logon type, and whatever activity followed.
Service-account interactive login. Start with service accounts paired with an interactive logon type specifically. Add source, target, prevalence, privilege level, and subsequent process or network behaviour.
Lateral movement hunts
Relevant telemetry: RDP, SMB, WinRM, WMI, remote services, administrative shares. Start simple: one workstation connecting to an unusually large number of internal servers, worth calling fan-out. Add a privileged identity, an unusual source, a short time window, and any process creation or new service/task activity on the destinations reached.
Network, DNS, persistence, impairment, staging and exfiltration hunts
A faster pass through several more categories, each following the same shape: start broad, add context, and correlate.
First-seen destinations. Which domains or IPs appeared for the first time recently. Add the process responsible, the user, ASN, domain age, prevalence, byte volume and destination category.
Rare destination. One host contacting infrastructure nothing else in the environment touches.
Beaconing. Start with repeated connections to the same destination. Add periodicity, similar byte size across connections, connection duration, the responsible process, and how rare the destination is. Worth remembering plenty of entirely legitimate software beacons constantly: EDR agents, monitoring tools, cloud software, and update agents all do this by design.
DNS. A high count of unique subdomains, unusually long labels, high entropy in the names themselves, a large number of NXDOMAIN responses, or unusual TXT record usage. Correlate with process, user, endpoint and network destination. Worth real caution here, since modern legitimate software can produce genuinely strange-looking DNS traffic as a matter of course.
Persistence. Scheduled tasks, services, Run keys, new accounts, startup changes. Evolve from "a new scheduled task exists" toward "a new scheduled task created by an unusual process shortly after external network activity."
Security impairment. EDR sensor loss, logging changes, AV configuration changes, security services stopping. Then check whether the same account or host also shows suspicious authentication, lateral movement, or administrative changes around the same time. Multiple security-tool failures occurring together deserve considerably more attention than one isolated broken sensor.
Data staging. Unusual archive creation, large compressed files, mass access of documents, staging in temporary or shared directories. Correlate with the responsible process, the identity involved, the eventual destination, and outbound traffic volume.
Exfiltration. Unusually high outbound volume as a starting point. Evolve toward a first-seen external destination, a sensitive server as the source, archive creation immediately beforehand, a newly used cloud storage provider, or a privileged user involved. Worth remembering that backups and entirely legitimate data transfers can look genuinely similar to this pattern.
Email and identity hunts
MFA fatigue. Repeated denied prompts followed by a successful authentication. Mailbox rule creation. Especially shortly after unusual authentication. OAuth consent. New application grants carrying unusual or broad permissions. Internal phishing. A user unexpectedly begins sending campaign-style messages outward. These connect directly to the Identity Attacks guide and the phishing investigation guide, both of which cover this territory in far more depth.
Ransomware precursor hunting
This connects directly to Ransomware Before the Ransomware. Hypothesis: if an attacker is preparing for ransomware deployment, unusual privileged access, discovery activity, lateral movement, backup interference, or defence impairment may all be visible before encryption ever starts.
remote access
↓
privileged authentication
↓
discovery
↓
lateral fan-out
↓
backup/security changes
Worth being deliberate about not searching only for known ransomware hashes here; by the time a hash match fires, most of the useful opportunity to interrupt this chain has usually already passed.
Hunt from incidents, not just threat feeds
Worth treating as a genuine principle rather than an aside. If an incident involved a specific scheduled task, a specific PowerShell pattern, and a specific remote service, don't only search for the exact hashes and IPs involved. Ask what behaviour would remain if every one of those specific indicators changed. That question is what turns a one-off IOC sweep into hunt logic that actually survives the attacker's next variation.
A mental model for building queries
Entity
+
Behaviour
+
Context
+
Time
For example: a user, paired with failed authentications, against many target accounts, within ten minutes. Or: a host, paired with PowerShell execution, paired with a new destination, within five minutes. This four-part shape is a genuinely useful way to construct almost any hunt from scratch.
Time windows matter more than they seem to
Five failed logins spread across six months reads completely differently from five failed logins inside ten seconds. Fifty server connections over a month is routine administration. Fifty server connections in ninety seconds is fan-out. The window is doing a lot of the actual analytical work here, often more than the raw count itself.
Aggregation is a hunting skill in its own right
Count, distinct count, grouping, minimum and maximum time, first seen, last seen: these are the tools that turn raw log lines into an actual question with an answer. Changing the grouping changes the question entirely. Failures grouped by user asks one thing. Grouped by source IP asks something else. Grouped by source IP with a distinct count of targeted users is what actually starts to reveal a spray pattern, since it's specifically counting breadth rather than volume.
Entity pivoting
Start with a host, and pivot outward to its processes, its users, its network activity, its DNS queries, its authentication events, its files. Start with a user, and pivot to their devices, their logins, their processes, their mailbox, the resources they've touched. Start with a domain, and pivot to the hosts that contacted it, the processes responsible, its DNS history, related IPs, certificates, and any email referencing it. Threat hunting, in practice, is mostly repeated entity pivoting done with discipline.
Prevalence, precisely
How many hosts, how many users, how often, when first seen, when last seen, unique or common. Worth holding the distinction between rare and suspicious apart deliberately, the same way earlier articles in this series hold observation apart from interpretation: rarity is a fact about frequency. Suspicion is a judgement that still needs the surrounding context to earn.
Hunting with negative space
Sometimes what's missing is itself the signal: a privileged login with no corresponding expected management host behind it, an endpoint that stops reporting immediately after suspicious administrative activity, an authentication with no expected device context attached to it at all.
Watch out
Missing logs can just as easily come from an ingestion failure, a retention limit, clock issues, or a plain collection gap. Don't interpret absence as malicious evidence automatically; confirm the absence is genuine before reading anything into it.
Hunting blind spots
Sometimes a hunt's real result is "we cannot answer this question," and that's a genuinely valuable finding in its own right. Command lines that were never collected, VPN logs that don't exist, DNS retention capped at seven days, servers with no EDR coverage at all, identity telemetry scattered across systems that were never centralised. The hunt has produced a visibility finding rather than a security one, and that's still worth writing down and acting on.
Hunting feeds detection engineering
A hunt is temporary and exploratory. A detection is continuous, operational logic running all the time. If a hunt repeatedly surfaces genuinely useful, high-risk behaviour, the natural next question is whether it should become a standing detection.
Hunt
↓
Useful behaviour discovered
↓
Refine logic
↓
Measure false/benign matches
↓
Detection candidate
↓
Test
↓
Deploy
Not every hunting query should graduate into an alert. Reasons it might not: too noisy to run continuously without drowning the queue, it requires an analyst's judgement to interpret properly rather than a clean yes/no, it's only useful periodically rather than in real time, it's computationally expensive to run constantly, or its fidelity simply isn't strong enough on its own yet.
Hunting and purple teaming
Controlled, authorised simulation can help answer a specific question: does the relevant telemetry actually exist, does the hunt logic actually see it, and does the resulting detection actually fire. This is worth understanding conceptually as a way of testing hunt and detection logic end to end, without needing any operational detail about how a simulation itself would be constructed.
Documenting a hunt
Hypothesis. What were we actually looking for. Data sources. What evidence did we query. Time period. What window did we examine. Queries. What logic did we actually run. Results. What did we find. Interpretation. What did it mean. Gaps. What couldn't we see. Follow-up. Incident, detection, a logging improvement, or genuinely no further action. Writing this down consistently is what makes hunting repeatable rather than something that lives only in one analyst's head.
A hunt that finds nothing is not a failed hunt
Worth being precise about what "nothing found" actually means: no evidence observed in the telemetry available, the hypothesis rejected for this specific period, the telemetry available being insufficient to answer the question properly, or the query itself needing refinement before it can be trusted.
Analyst tip
Don't write "there is no compromise" unless the evidence genuinely supports that specific, stronger claim.
Common mistakes
Opening the SIEM and searching randomly with no hypothesis at all. Only ever searching known threat-intelligence indicators. Treating any anomaly as automatically malicious. Building huge allowlists immediately after the first noisy result. Over-filtering the very first query before you've seen what the broad picture even looks like. Failing to record the time range a hunt actually covered. Ignoring missing telemetry rather than flagging it. Stopping the scope at one host. Never checking prevalence at all. Failing to pivot between different data sources. Turning every single hunt into a permanent alert regardless of fidelity. Assuming no results means no attacker. Hunting without first understanding what normal actually looks like in this specific environment. Searching for ATT&CK technique IDs as though they were indicators rather than descriptions of behaviour. Copying queries from the internet without validating that the field names and data model actually match your own environment.
Good first threat hunts
Office spawning PowerShell. Rare processes across the estate. Rare outbound destinations. Service-account interactive logons. Privileged accounts authenticating from unusual sources. New scheduled tasks. New services. First-seen RMM tools. Failed-authentication spray patterns. RDP fan-out. Unusual PowerShell command lines. New mailbox forwarding rules. Security-agent failures. These are worth starting with because they're conceptually easy to understand, they teach the pivoting habit directly, they have plenty of genuinely legitimate examples mixed in to force real discrimination, and they push an analyst to actually learn their own environment rather than apply someone else's assumptions to it.
Intermediate hunts
Process activity correlated with network activity. Credential access followed by a subsequent login. Unusual privileged lateral movement. A new destination followed by something resembling persistence. Archive creation followed by an external transfer. Authentication anomalies followed by mailbox changes.
Advanced hunts
Temporal attack sequences spanning multiple stages. Entity relationship baselines built over time. First-seen behaviour correlated across several independent data sources at once. Peer-group comparisons, where one identity or host is measured against others that should behave similarly. Graph-based lateral movement analysis. Multi-stage ransomware precursor chains. Cloud and endpoint session compromise correlated together. "Advanced" here describes complexity, not necessarily value; plenty of the simple hunts above catch genuinely important activity just as effectively.
Worked hunt: Office to PowerShell
Hypothesis: Office applications spawning scripting interpreters on standard user workstations is rare in this environment, and instances followed by network activity may indicate malicious document execution.
Query 1. Office spawning PowerShell, broadly, across the whole estate. Result: far too many to review individually, which is expected and fine at this stage.
Query 2. Add user and host context to the same result set. Patterns start to emerge: certain hosts or teams account for most of the volume.
Query 3. Add command-line context specifically. Encoded arguments, unusually long command lines, or references to remote content start to separate from routine automation.
Query 4. Add outbound network activity following the process creation. The result set narrows sharply toward instances that actually reached out somewhere afterward.
Query 5. Check prevalence across the remaining set: how many hosts, how many users, how often, first seen when. One host stands out as genuinely rare against this specific pattern.
Pivot. That one interesting host becomes the new focus. Investigate its DNS activity, any file creation, associated identity activity, related email delivery, and anything resembling persistence. At this point the hunt has stopped being a hunt and become an actual incident investigation, which is exactly the intended outcome when a hunt succeeds.
Worked hunt: suspicious authentication
Hypothesis: a password spray may be occurring somewhere in the environment right now.
Start broad: all failed authentication events across a reasonable window. Group by source, then by the distinct count of unique accounts targeted from each source, then by the time window each source's activity fell within. One source stands out: many distinct accounts, relatively few attempts against each, all inside a short window, which is the classic spray shape rather than a single account being brute-forced.
Next: search for any successful authentication from that same source, across the same window and shortly after. Next: investigate whatever accounts succeeded specifically, following the full identity investigation methodology covered in the Identity Attacks guide. This walkthrough is really a demonstration of how aggregation, specifically changing what you group by, is what turns a wall of raw failed-login events into an actual hunting lead.
Worked hunt: ransomware precursor
Hypothesis: an attacker with privileged access preparing for ransomware deployment may produce an unusual pattern of lateral access and defence impairment before any encryption starts.
Search for privileged remote sessions across the estate, host fan-out from any single source, administrative access to backup infrastructure specifically, and any recent security-tool configuration changes. No single one of these findings is sufficient evidence on its own. The value here is entirely in whether several of them line up on the same identity, the same host, or the same tight time window, which is precisely the correlation-over-isolation theme running through the rest of this article.
SPL examples
Field names vary by environment and data model. These assume a fairly conventional Splunk setup with Sysmon or EDR-style process data (parent_process_name, process_name, process, dest, user) and standard authentication fields (user, src, action). Treat every field name below as something to check against your own CIM mapping or source data before running it, not as something universally correct.
1. Office spawning a scripting interpreter.
index=endpoint sourcetype=sysmon EventCode=1
  parent_process_name IN ("winword.exe","excel.exe","powerpnt.exe","outlook.exe")
  process_name IN ("powershell.exe","pwsh.exe","cmd.exe","wscript.exe","cscript.exe","mshta.exe")
| table _time dest user parent_process_name process_name process
| sort - _time
This is a Level 2 behaviour hunt: no domain, no hash, just the parent-child relationship itself. Assumes Sysmon process-creation logging (Event ID 1) is present and indexed. Likely benign matches: legitimate mail-merge or reporting macros, approved automation scripts, and helpdesk tooling that scripts Office as part of routine support work. Evolve it by adding process (the full command line) and filtering for encoded or unusually long arguments, then by joining against network telemetry for the same dest and time window to reach Level 4.
2. Rare process across the estate.
index=endpoint sourcetype=sysmon EventCode=1
| stats dc(dest) as host_count, values(dest) as hosts, earliest(_time) as first_seen by process_name
| where host_count <= 3
| sort host_count
Surfaces binaries seen on very few hosts. Assumes a reasonably complete Sysmon or EDR process feed across the estate; if coverage is patchy, "rare" here partly just means "ran on a host we happen to monitor." Likely benign matches: niche legitimate admin tools, one team's specialist software, freshly rolled-out agents still limited to a pilot group. Evolve by joining against a code-signing or file-reputation lookup to separate unsigned rarities from known vendor tools, then by adding parent process and any outbound network activity for the same events.
3. Failed-authentication spray pattern.
index=auth action=failure
| bin _time span=10m
| stats dc(user) as distinct_users, count as attempts by src, _time
| where distinct_users >= 15 AND attempts <= (distinct_users * 2)
| sort - distinct_users
Groups failures into ten-minute buckets per source, looking for many distinct accounts with relatively few attempts each, the shape of a spray rather than a brute force against one account. Assumes a normalised action=failure field and a consistent user/src mapping across whatever authentication sources feed this index. Likely benign matches: a misconfigured application repeatedly authenticating with a stale credential against multiple service accounts, or a bulk password-reset rollout landing in the same window. Evolve by joining against successful authentications from the same src shortly afterward, then pivoting into what those specific accounts did next.
4. RDP fan-out from a single host.
index=network sourcetype=firewall dest_port=3389 action=allowed
| bin _time span=1h
| stats dc(dest) as dest_count, values(dest) as destinations by src, _time
| where dest_count >= 10
| sort - dest_count
One source reaching an unusually large number of destinations over RDP inside an hour. Assumes port 3389 is a reasonable proxy for RDP in this environment and that firewall allow logs are indexed with consistent src/dest fields; adjust the port or add an application-layer field if your environment inspects RDP more precisely. Likely benign matches: a jump host, a patch-management server, or monitoring infrastructure that legitimately touches many systems by design. Evolve by excluding known administrative source hosts, then adding the authenticating identity and whether it's privileged.
5. First-seen external destination.
index=network sourcetype=proxy
| stats earliest(_time) as first_seen, count as total_hits, dc(user) as distinct_users by dest_domain
| where first_seen >= relative_time(now(), "-1d@d")
| sort - total_hits
Domains contacted for the first time within the last day, ranked by how much traffic they've already generated. Assumes proxy logs retain enough history for "first seen" to be meaningful; if retention is short, this query will report plenty of false "first seen" results that are really just outside the retention window. Likely benign matches: a new SaaS tool rolling out, a CDN endpoint that legitimately rotates hostnames, or a software update server. Evolve by joining against the initiating process on the endpoint side and filtering for destinations contacted by only one or two users, which narrows toward genuinely unusual activity rather than an organisation-wide rollout.
6. New scheduled task creation.
index=endpoint sourcetype=WinEventLog:Security EventCode=4698
| table _time dest user Task_Name Command
| sort - _time
A straightforward starting point for persistence hunting: every new scheduled task, assuming the relevant object-access audit subcategory is enabled (see the Windows Event Logs guide for the audit-policy dependency behind Event ID 4698). Likely benign matches: routine software deployment and maintenance tasks created by management tooling. Evolve by joining against process-creation events in the minutes immediately before task creation, to see what actually created it, then filtering for tasks whose target binary sits in a user-writable path.
7. PowerShell command-line prevalence.
index=endpoint sourcetype=sysmon EventCode=1 process_name IN ("powershell.exe","pwsh.exe")
| stats dc(dest) as host_count, count as total by process
| where host_count <= 5
| sort host_count
Ranks distinct PowerShell command lines by how few hosts they appear on. Assumes command-line auditing or Sysmon is actually capturing the process field with full arguments; without that, this query only sees bare invocations. Likely benign matches: a one-off diagnostic command an administrator typed interactively, or a script unique to a small team. Evolve by excluding command lines already known to be approved automation, then joining the remainder against network and file-creation activity from the same process instance.
KQL examples
Microsoft Defender's advanced hunting schema and Sentinel's SigninLogs use different field names than Splunk's CIM, worth translating deliberately rather than assuming a one-to-one mapping. These examples use verified current column names from DeviceProcessEvents, DeviceNetworkEvents and SigninLogs, though exact availability still depends on your Defender/Sentinel licensing and data connectors.
1. Office spawning a scripting interpreter.
DeviceProcessEvents
| where InitiatingProcessFileName in~ ("winword.exe","excel.exe","powerpnt.exe","outlook.exe")
| where FileName in~ ("powershell.exe","pwsh.exe","cmd.exe","wscript.exe","cscript.exe","mshta.exe")
| project Timestamp, DeviceName, AccountName, InitiatingProcessFileName, FileName, ProcessCommandLine
| order by Timestamp desc
Here FileName is the newly created process and InitiatingProcessFileName is its parent, the reverse of how a lot of people expect the naming to read at first. This is the equivalent of SPL example 1 above, translated field for field rather than reasoned about from scratch, which is deliberately the point: the underlying hunting logic doesn't change, only the schema does.
2. Rare process across the estate.
DeviceProcessEvents
| summarize HostCount = dcount(DeviceName), FirstSeen = min(Timestamp) by FileName
| where HostCount <= 3
| order by HostCount asc
dcount is KQL's distinct-count aggregation, doing the same job as dc() in SPL. Same caveats apply as the Splunk version: this only reflects hosts actually reporting into DeviceProcessEvents, which for Defender specifically means devices onboarded to Defender for Endpoint.
3. First-seen network destination.
DeviceNetworkEvents
| where ActionType == "ConnectionSuccess"
| summarize FirstSeen = min(Timestamp), TotalHits = count(), Devices = dcount(DeviceName) by RemoteUrl
| where FirstSeen > ago(1d)
| order by TotalHits desc
RemoteUrl in this table holds the domain or FQDN being connected to, and ActionType needs filtering to successful connections specifically, since the table also records attempts that were blocked. Evolve this by joining against InitiatingProcessFileName to see what actually made the connection, using ProcessId and DeviceId as the join keys.
4. Failed sign-ins suggesting a possible spray.
SigninLogs
| where ResultType != 0
| summarize DistinctUsers = dcount(UserPrincipalName), Attempts = count() by IPAddress, bin(TimeGenerated, 10m)
| where DistinctUsers >= 15 and Attempts <= (DistinctUsers * 2)
| order by DistinctUsers desc
ResultType of 0 means success in Entra sign-in logs, so != 0 captures failures; bin() is KQL's equivalent of SPL's bin _time span=. This is the direct KQL counterpart to SPL example 3, and worth noting: if you're comfortable thinking in Splunk's stats ... by field, bucket shape already, summarize ... by field, bin(...) is close enough that the translation is mostly syntax, not new concepts.
Things worth being able to explain in a SOC interview
The practical difference between reactive alert investigation and hypothesis-driven threat hunting. What makes a hunt hypothesis genuinely testable rather than vague. The difference between hunting for an indicator and hunting for a behaviour. Why prevalence matters and how it's different from suspicion. What baselining actually means in practice. How aggregation and grouping change the question a query is asking. Why time windows matter as much as the events themselves. What entity pivoting looks like across a real investigation. Why correlation across sources produces stronger leads than any single strong signal. How a hunt becomes a detection, and why not every hunt should. What a hunt with no findings actually tells you. What telemetry gaps are and why a hunt can surface them as its main result. And why genuinely knowing your own environment's normal behaviour matters more than knowing a long list of attacker techniques.
Six scenarios to practise
Find potential password spraying. Hypothesis: one source authenticating against many accounts with few attempts each in a short window. Likely telemetry: authentication logs with source, account and result. First search: failures grouped by source and distinct account count within a bounded time window. Next pivot: any subsequent successful authentication from the same source.
Find unusual service-account use. Hypothesis: this service identity is authenticating somewhere, or in some way, it doesn't normally. Likely telemetry: authentication logs filtered to known service accounts, plus a historical baseline of their normal sources and logon types. First search: service-account logons with an interactive logon type specifically. Next pivot: subsequent process or network activity from that session.
Find Office launching scripting tools. Hypothesis: an Office process spawning a script interpreter, particularly followed by network activity, may indicate document-based execution. Likely telemetry: process-creation events with parent-child relationships. First search: the broad parent-child pattern across the estate. Next pivot: command-line content, then outbound network activity from the resulting process.
Find possible lateral RDP movement. Hypothesis: one host reaching an unusual number of internal servers over RDP in a short window. Likely telemetry: firewall or network flow logs, plus authentication logs. First search: RDP connections grouped by source with a distinct destination count. Next pivot: the identity authenticating across those sessions and whether it's privileged.
Find first-seen external infrastructure. Hypothesis: a domain or IP contacted for the first time recently may represent new attacker infrastructure, or equally a new legitimate service. Likely telemetry: DNS or proxy logs with sufficient retention to establish "first seen" meaningfully. First search: destinations with an earliest-seen timestamp inside a recent window. Next pivot: the process and user responsible, and how many other hosts have since contacted the same destination.
Hunt for potential ransomware preparation. Hypothesis: privileged remote access, discovery, lateral fan-out and backup or security-tool interference may all be visible before encryption starts. Likely telemetry: identity logs, process-creation events, network flow data, and backup-system access logs. First search: privileged remote sessions correlated with host fan-out in the same window. Next pivot: whether the same identity or host also shows backup access or security-tool configuration changes.
Quick reference
HYPOTHESIS
What behaviour am I looking for?

TELEMETRY
Where would I see it?

SEARCH
What is the broadest useful first query?

BASELINE
What does normal look like?

PIVOT
What entities connect to the result?

VALIDATE
What actually happened?

SCOPE
Where else is it happening?

OUTCOME
Incident, detection, visibility gap or no finding?
This piece connects most directly to Alert to Conclusion for the general investigation discipline behind hypothesis testing, Windows Event Logs for the telemetry behind several of the hunts above, PowerShell and LOLBins for the behavioural reasoning behind the process-based hunts, Identity Attacks and From Header to Host for the authentication and email hunts, Ransomware Before the Ransomware for the precursor-chain reasoning, and How to Think Like a SOC Analyst in an Interview for the underlying hypothesis-driven mindset this entire article is really an extension of.
The point
Don't begin by asking what query to run. Begin with what behaviour you actually suspect, what evidence that behaviour would leave behind, and whether you genuinely collect it. Only then does it become a search worth running. And as the hunt develops, deliberately evolve it: indicator, to behaviour, to context, to correlation, to sequence, to scope. That progression is the entire discipline, and it holds up regardless of which platform, which query language, or which specific attacker technique happens to be in front of you this time.